Dataviz & Dashboard Design Framework
- Sep 7, 2019
- 1 min read
Appdynamics provides a variety of data-centric products for the customers to manage their application performance and correlate it with their business. This is a project to create a design language and system, especially for data visualization and dashboarding, to provide a unified experience across all Appdynamics products for the customers to interact and slice-n-dice the data.
My role in this project is leading the effort of investigating common data types and charts which already exist in the current products in different forms, and provide a unified design that fits into different use cases. I also provide interactive rapid prototypes in D3.js for testing core interactions with the users, and sample Highcharts.js code of the final design to the UI engineers.
Collection of Charts

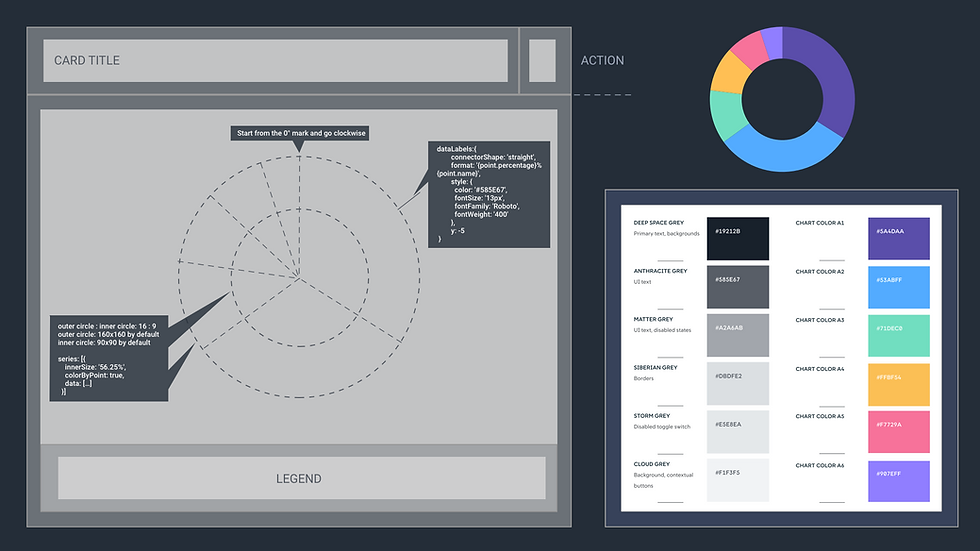
Chart anatomy example: Donut chart in the Card container
Interaction Exploration of Time-Series Line Chart

Rapid D3.js Prototype for Line Chart Interaction TestingChart Data-binding and Styling

Experience Design for Dashboard Creation

Inter-chart Actions Configuration


Comments